Written by Joe Connell, Butte County Farm Advisor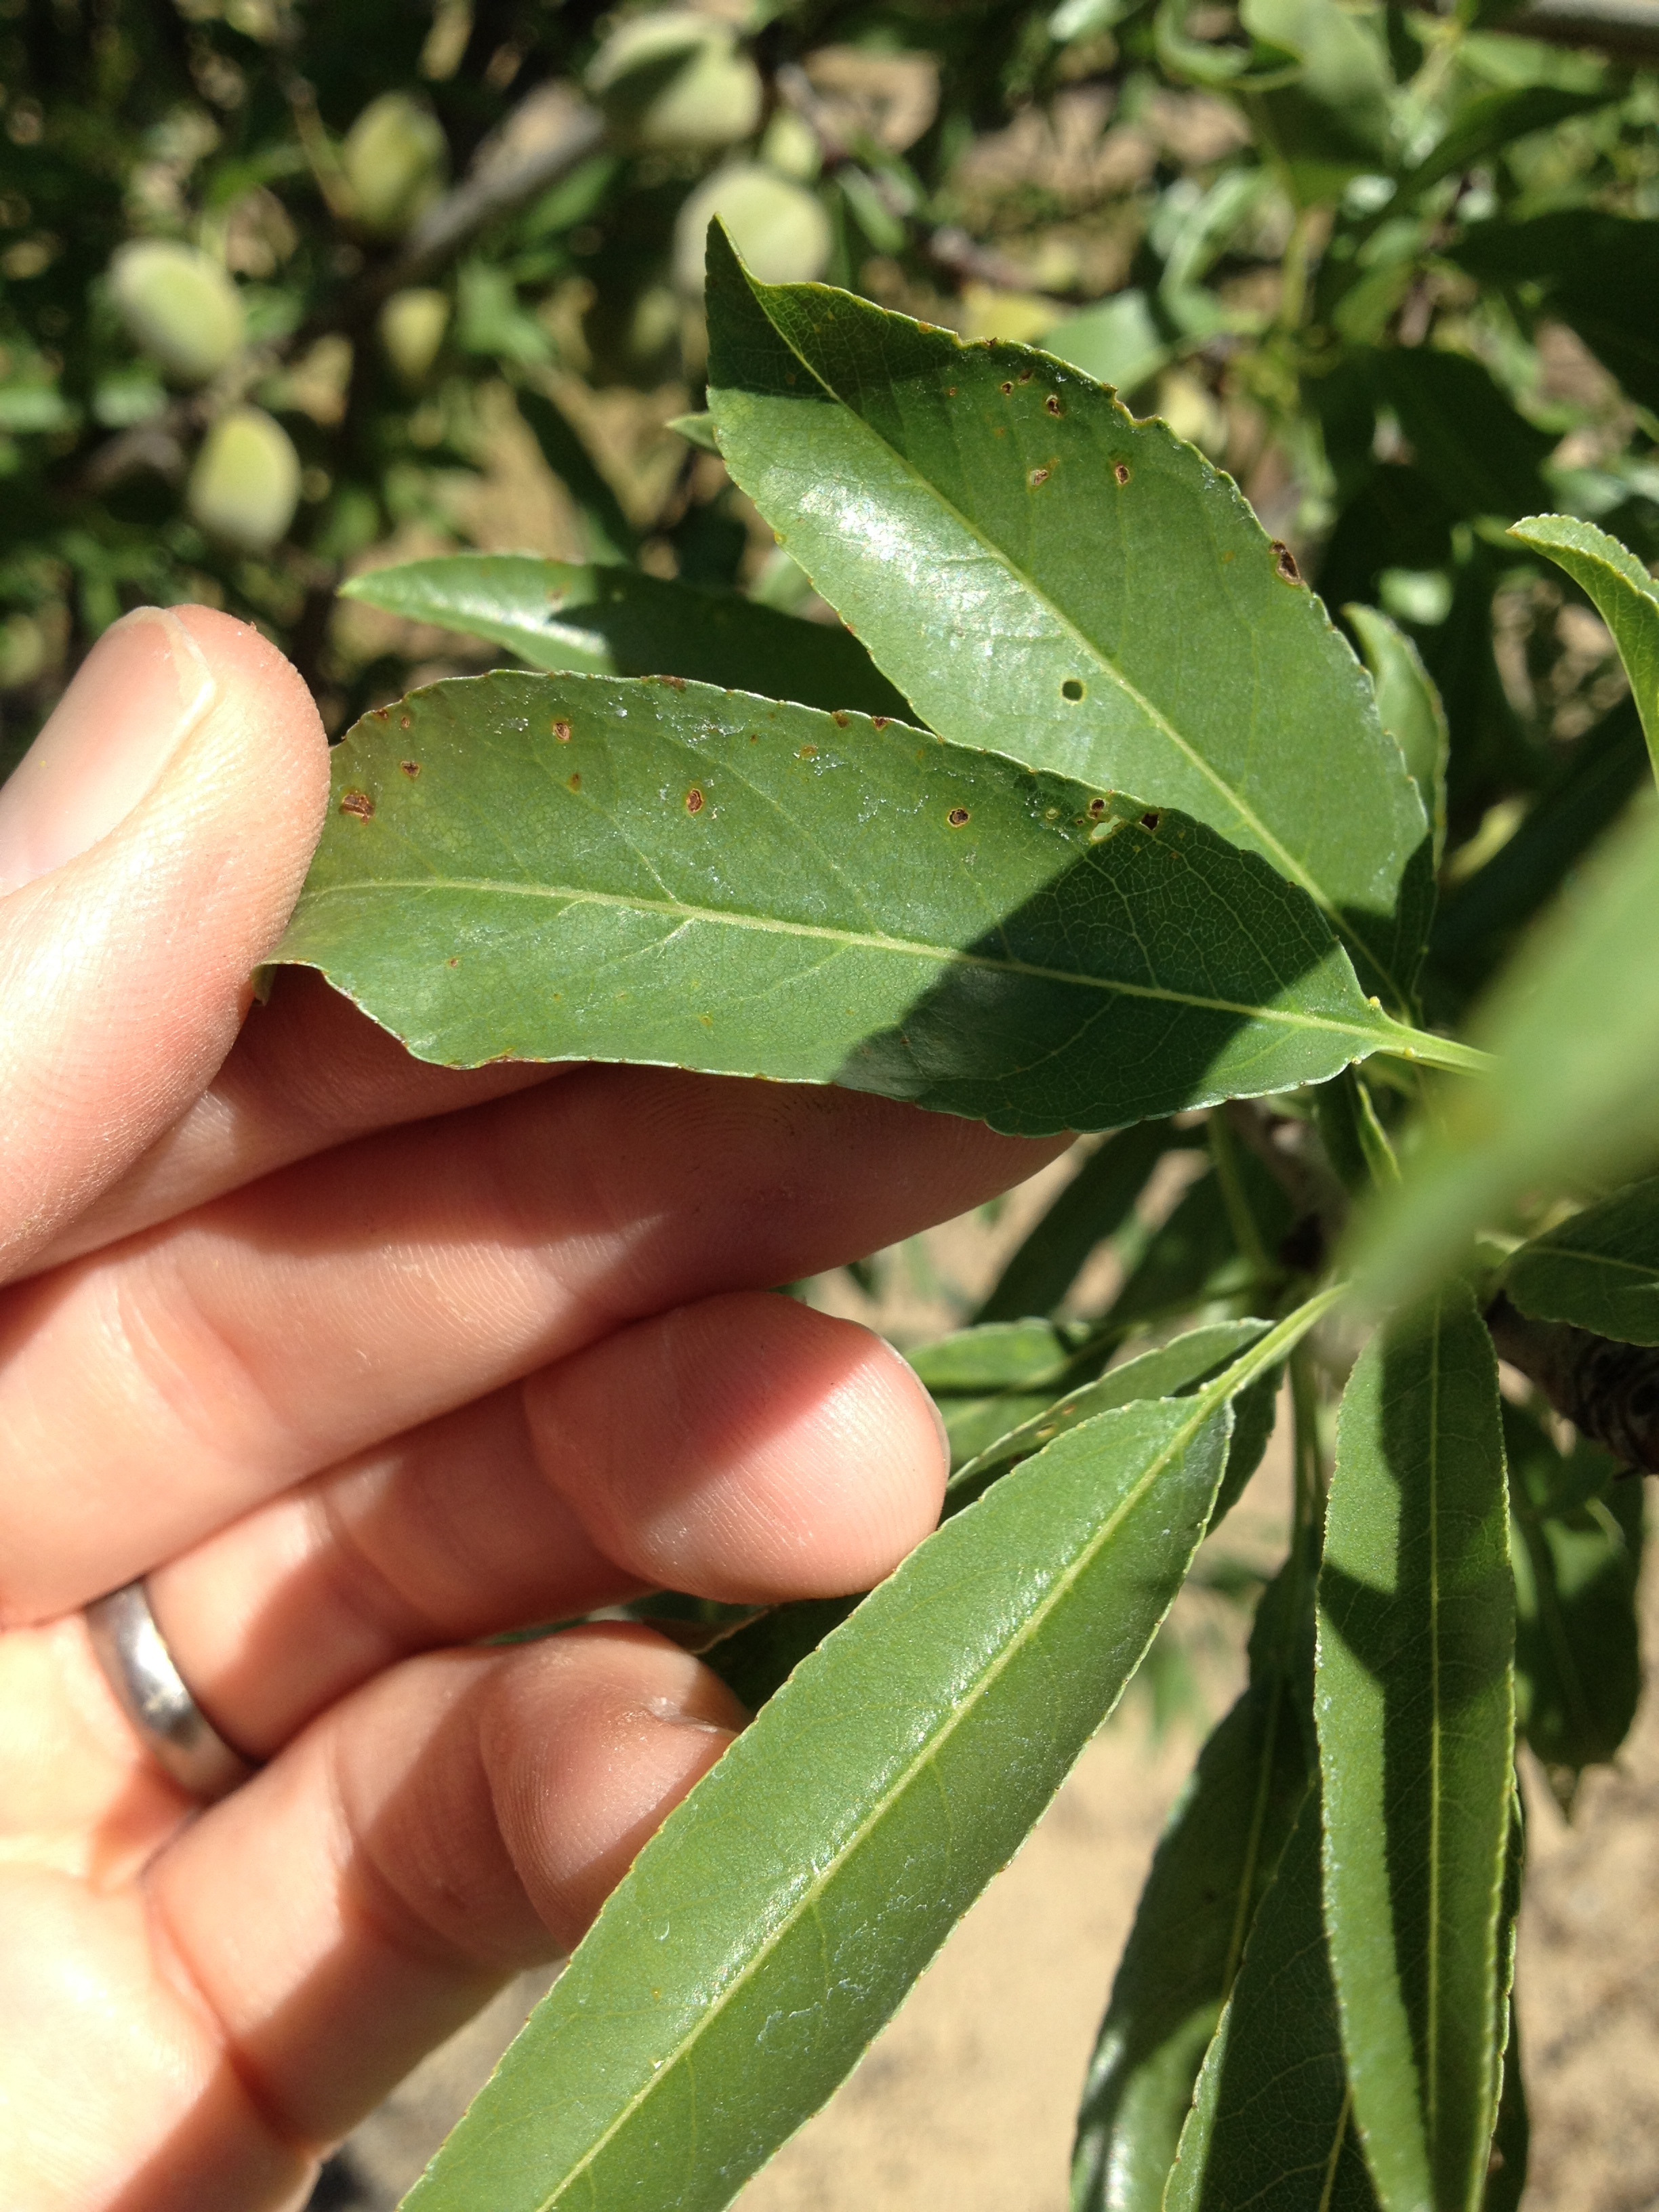
Leaf analysis for the full range of nutrients is best done in July when nutrient levels in leaf tissue are stabilized. Published July critical values established for almond by U.C. researchers can help guide you in your fertilization practice. Analysis can reveal specific nutrient deficiencies or can alert you to developing trends when results are compared from one year to another. Keeping trees in the adequate zone for nitrogen can save on fertilizer costs by helping to avoid over fertilization.
Excessive amounts of chloride, sodium and possibly boron, depending upon location, should be monitored if water quality is poor and/or chloride is a component of the fertilizers frequently used in the orchard. With this year’s drought conditions and changing water sources pay particular attention to these potentially damaging elements when selecting analyses from the lab. Hull samples at harvest are the most sensitive test for orchard boron status.
Leaf nutrient levels change through the growing season. Concentrations of nitrogen, phosphorus, and zinc on a leaf dry-weight basis start very high early in the season and decline rapidly to a fairly steady state after mid-June, levels plateau and then drop off again from September to leaf fall. Potassium starts high in the spring then decreases reaching a plateau about the same time as nitrogen, phosphorus and zinc. Concentrations of magnesium, manganese, boron and chloride remain fairly constant or increase slightly during the season. Boron, chloride, and sodium however, will increase steadily if excess amounts are present in the soil or water. Calcium is the one element that always starts low and increases steadily over the season as the leaves age.
Most laboratories group these nutrients together in one easily requested analysis. Note that if micronutrients have been applied in a foliar spray (including fungicides such as ziram, Manzate, and/or Ph-D), contaminated leaves will show excessively high levels of those nutrients and the reported levels should be disregarded.
The new protocol for April leaf analysis is used to give an advance estimate of only July nitrogen levels that can be compared to the July critical value by entering the April nutrient level results into the Nitrogen estimating program. There are no standards for critical values in April for any of the nutrient levels.
When comparing lab results from one year to the next, or for an April and July sampling, it is important to consistently use the same sampling methods. The following methods should be followed:
- Sample uniform, representative trees across the block at least 90 feet apart.
- To overcome tree to tree variability, collect a representative sample from a minimum of 18 to 28 trees.
- From each tree, collect all the leaves from 5 to 8 well exposed, non-fruiting spurs around the canopy located between 5 and 7 feet from the ground.
- A minimum of 100 leaves per sample should be combined in a single paper bag for analysis.
Leaves selected for analysis should be free of obvious tip burn, insect or disease injury, mechanical damage, etc., and should be from normal, healthy trees. If you have a weak area and you’d like to diagnose the problem, sample that area and compare the results with those of a sample from your best area to see if tree nutrition might be involved.
Deficiencies that are most common in this area are nitrogen, potassium, and zinc. Zinc deficiency is most common in sandy or high pH soils and old barnyard locations and is easily identified in the field from leaf symptoms early in the season. Boron deficiency is more prevalent on sandy soils or on soils near the foothills. Manganese and iron deficiencies are sometimes seen on high pH soils or where soils are too wet or have areas with high water tables. Useful critical values are not established for iron or sulfur levels in almond leaf tissue.
Critical values for July leaf samples are shown in Table 1. Keep the results with your fertilizer application and yield records to better evaluate and estimate future fertilization needs. For more information on nutrient deficiencies and toxicities, sampling procedures, and critical values, see Chapter 26 in the Almond Production Manual, Publication 3364.
Remember, leaf analysis is only a helpful guide in orchard management. Leaf levels should be considered along with orchard appearance and growth before corrective action is taken. Visual observation is an excellent complement to any lab analysis. Make sure that a deficient element is really the problem before you seek fertilizer applications as a solution.
Table 1. Critical nutrient levels for almond leaves*sampled in July (Almond Production Manual; UC ANR Pub. 3364).
| Nutrient | Deficient | Adequate | Excessive over |
| Nitrogen (N) | < 2.0% | 2.2-2.5% | > 2.7% |
| Phosphorous (P) | 0.1-0.3% | ||
| Potassium (K) | < 1.0% | > 1.4% | |
| Calcium (Ca) | > 2.0% | ||
| Zinc (Zn) | < 15 ppm | ||
| Manganese (Mn) | > 20 ppm | ||
| Copper (Cu) | > 4 ppm | ||
| Magnesium (Mg) | > 0.25% | ||
| Sodium (Na) | > 0.25% | ||
| Chlorine (Cl) | > 0.3% | ||
| Boron (B) | < 30 ppm | 30-65 ppm | > 300 ppm |
| **B Hull levels | >80 ppm |
* Fully expanded leaves from non-bearing spurs sampled in July.
** Use analysis results of hulls sampled at harvest to best assess almond boron status.