
Written by Franz Niederholzer1 and Kitren Glozer2
1UC Farm Advisor, Sutter/Yuba Counties, 2Associate Project Scientist, Department of Plant Sciences, UC Davis
“Is it a good chilling year?” That’s a common coffee house question this time of year in fruit and nut growing regions. The amount of chilling a perennial crop accumulates in a given winter will influence bloom conditions – the most crucial time in a crop season. Less chilling than a certain tree crop requires can lead to an extended bloom; too little altogether can result in bud death and drop in some crops like apricot and sweet cherry. ‘Good chilling’ (more chilling than the minimum required) can produce a very short bloom season, or ‘snowball bloom’. Chilling models can provide growers and their advisors with key information to time dormancy-breaking materials (hydrogen cyanamide, oil, etc.) to manipulate bloom to improve or maintain yield and quality in regions where local chilling is marginal for a certain crop. Climate change may make achieving critical chilling more important in years to come. In this article, we’ll briefly review chilling and chilling models.
Deciduous perennial crops break bud in the late winter or spring after a certain amount of cold weather (chilling) followed by a certain amount of warmer weather. Think of this process as a relay race. The chilling is the first leg of the race, and the heat accumulation is the second leg. Bud break is the finish line. The length of each leg of the race depends on crop and variety. The weather during the race influences the runner’s speed. Good chilling weather speeds up the chilling leg, warmer weather can slow it down or even stop it. Cool weather on the warming leg slows the progress towards bloom. Since most perennial crops are not native to North America, matching the chilling and heat requirements of a variety to the climate of a given orchard site is key to sustainable production. To get an idea of when the baton handoff occurs in the race to bloom, chilling models are used. These models are the product of decades of research. Chilling models represent our understanding of how a part of nature works. (We’re making some progress…)
Prior to 1970, the most commonly used chilling model was based on hours under 45oF (1 hour below 45oF is a ‘chill hour’). The ‘Modified Chill Hour’ model measures chilling as 1 hour at or below 45oF. In California, chilling accumulation measurement traditionally begins on November 1 and ends on March 1. These timings are based on historical averages, but chilling can accumulate earlier and later as well, when a chilling model is used to start and stop the clock. Annual chilling hours (CH) accumulation sums all the hours under 45oF (or hours ≤ 45oF) between those dates.
Subsequent research and experience showed that chilling as the plant perceives it is more complicated than just hours under 45oF. Winter temperatures below freezing provide no metabolically effective chilling. Temperatures between freezing and 54oF provide chilling along a sliding scale around an optimum of 45-47oF. Chilling units may be lost when temperatures reach above 60oF. This research resulted in several new models to explain plant blooming behavior in relation to weather in the dormant season.
The first of these was developed by researchers at Utah State University. Known as the Utah Model, it accounts for the negation of chilling by high winter temperatures. Each hour of the day was given positive, negative or no chilling units based on the temperature in that hour. The Utah model works well in temperate growing regions of the world with generally cold winters, such as continental regions of North America. It doesn’t accurately track chilling in coastal growing regions where warm winter temperatures are common and cold periods alternate with warm periods.
A new model was developed in Israel in the late 1980’s. It incorporated research showing that high temperatures negate chilling, but only within a period under 48 hours. The Dynamic Model measures chilling in units called chilling portions (CP). One portion = 28 hours at 6oC (43 oF), or more than 28 hours at somewhat less effective temperatures (44 oF-55 oF). The Dynamic Model accumulates fewer chilling units (called portions) for the same site compared to the other models—for example, a dormant season of 1500 CH may ‘equal’ 95 CP. The Dynamic Model is complex and requires hourly data and a computer to calculate. It is also the most accurate of the chilling models currently available.
South African researchers modified the Utah Model by ignoring negative chilling units accumulated over a 24 hour period. If negative chilling units are accumulated over a 24 hour period, the total is just “zeroed out”. This model is referred to as the Daily Positive Utah Chilling Model. This model performs similarly to the Dynamic Model. More information on the dynamic model can be found here and here.
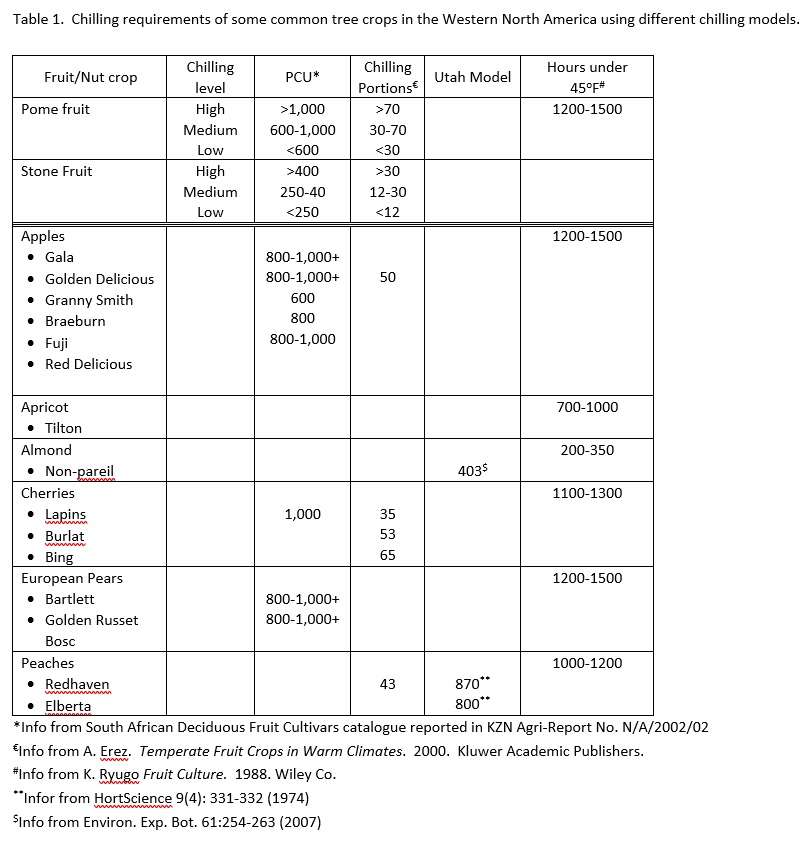
Where does all this leave a fruit or nut grower wishing to use the most accurate chilling model currently available? The Dynamic Model and the Positive Utah Chilling Model work well in cold or warm winter climates. The Utah Model works well in cold winters, but not in warm ones. The under 45oF model is dated, but will tell you if it’s a cold winter or warm winter. Chilling units required for adequate chilling for a range of tree crops using several different models are listed in Table 1. These data were obtained from a range of sources and should be considered general chilling targets.
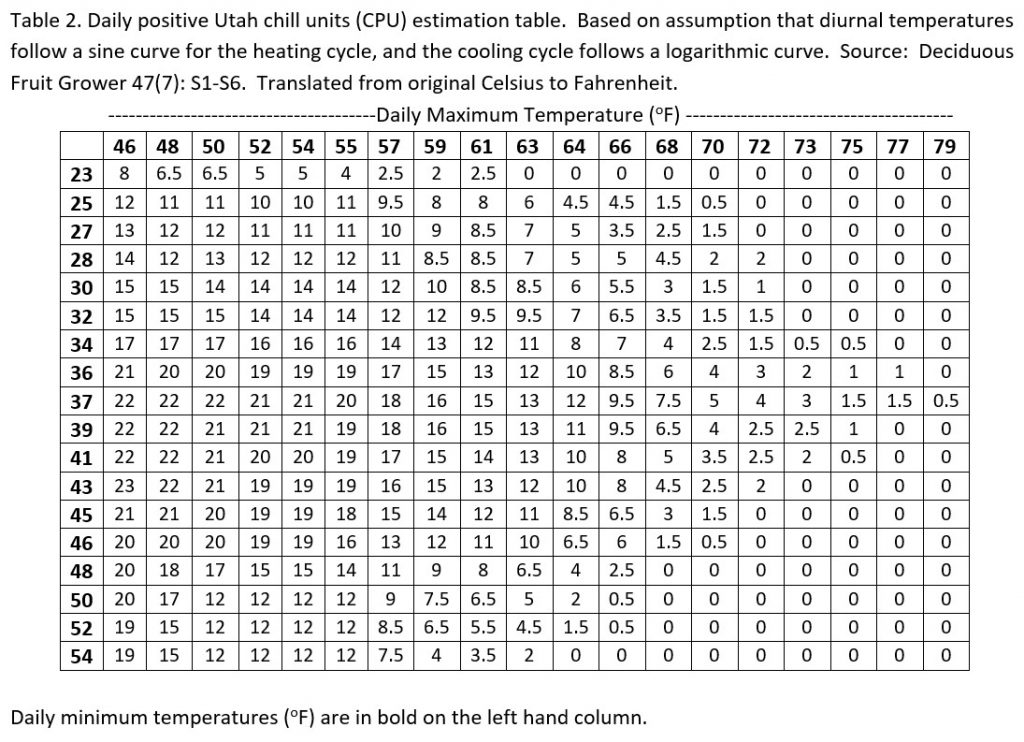
Where can you go to track chilling accumulation? California growers (or anyone else) can log onto http://fruitsandnuts.ucdavis.edu/ and click on “Weather Services” to look at current and historical chilling accumulations from automated weather stations around the state. Several models are available at this site. A ‘How-To’ Guide for using the Dynamic Model from on-line data or a datalogger set up in an orchard (including how to use a datalogger) can be obtained on the same site at http://fruitsandnuts.ucdavis.edu/Weather_Services/ . Look for the link at the bottom of the page indicating the availability to download. Any computer set up to run Excel can use the Dynamic Model program with publicly-accessed weather data or datalogger data from your own orchard. To estimate Positive Utah Chilling Units with daily max and min temperatures, Table 2 can be used.
For further information on chill, please review these previous postings on “The Almond Doctor:”
Is last year’s warm winter the new normal?, written by Katherine Jarvis-Shean
Counting chill better – using the chill portions model, written by Katherine Jarvis-Shean
Chilling requirements in chill portions for California crops, written by Katherine Jarvis-Shean

Giovanni Damato+I have a Vantage Pro 2 station.The files are registered on my PC with extension .WKL.How can I read the filies? It is possible to read with Weatherlink program?It is possible to convert in XLS?ThanksGiovanni Damato
January 16, 2021The sites named on this post do not work for download the Dynamic Model program.
Until some weeks ago on http://fruitsandnuts.ucdavis.edu was write :site vandalized.
thanks
Gio
David Doll
January 16, 2021Thanks Gio,
Sorry they didnt work, they keep moving things around. I updated with the recent link. Here is it just in case you cant find it: http://fruitsandnuts.ucdavis.edu/Weather_Services/chilling_accumulation_models/ Look for the hyperlink saying “Available for Download”.
In regards to the Vantage Pro 2 station, please check with the software or hardware manufacturer on your issues to convert them to an excel file. Considering there are several dozen weather station systems, I dont have the feasibility to help with these types of issues.
Hope that helps.
Giovanni Damato
January 17, 2021Thank a lot
Gio