
Crop coefficients for almond have been studied for nearly 50 years. These values indicate the ratio of water use of almonds in comparison to fully irrigated grass (ETo). Values less than one indicates that almonds are using less water than grass at that period while values greater than one indicate a higher water use. This ratio needs to be multiplied by the daily ETo, whether actual or estimated, to determine the water usage for almonds.
The crop coefficients provided below are research derived. Differing techniques have been used to develop the coefficients. Some rely on a “water-balance” method in which soil moisture levels are monitored and maintained to match water use. This method has been utilized by many researchers across the world and has formed the foundation of most irrigation research. A more exact method of this technique involves the use of a weighing lysimeter, which is a giant scale that measures the amount of water used by the tree. Due to a minimal number of lysimeters in the world, studies have not been performed until recently and the results for mature almond water use has yet to be published.
Outside of the “water-balance” method, there are newer technologies that have been used to develop crop coefficients. These techniques utilize fluctuations of canopy temperature that occur from transpiration loss. These measurements, when taking into account solar radiation, wind, and ambient air temperature and humidity, can be used to back-calculate the water loss. This method is known as “eddy covariance.”
When reviewing the differing crop coefficients, it will be clear that the general trend is greater water use. Some of the upward trend is due to a change in irrigation practices and orchard canopy densities – the switch from surface/flood irrigation methods to pressurized drip and microsprinkler orchards as well as tighter spaced, densely canopied orchards. Another possible cause is the technique in which water use is being measured. The eddy-covariance methods utilized in modern research are more precise and accurate, and as such, are more sensitive. Water-balance methods were developed using a combination of soil moisture, water flow, and plant-water status measurements. These methods give these values a more “in-practice” feel.
In theory, the Kc value, when multiplied by the ETo, represents 100% irrigated, full vigor, unstressed mature tree. This means that the calculated water indicates the maximum amount of water use by the tree, not the amount of water that is optimal for the specific orchard conditions. This is important to highlight as our ability to apply water is limited by a number of factors including soil infiltration rates and uniformity of water applications. Uniformity of application (also known as distribution uniformity) is limited by engineering constraints as it is not possible for irrigation systems to have 100% uniformity. This means that there are areas of the field that are over-irrigated, which can reduce yield and kill trees.
Kc values are variable. This is due to the changing status of the tree’s canopy. As leaves emerge and fully expand, water use is increased. As crop is harvested and leaves senesce and drop from the tree, it decreases. These changes must be taken into account in order to properly irrigate a tree through the season.
When determining which Kc values to use, strongly consider the ones developed within the past 15 years. These values utilized modern orchards and more refined research methods to develop an up-to-date set of values. Due to the risk of over-irrigation with modern crop coefficients derived from eddy-covariance, one should consider irrigating at a lower percentage of full irrigation. Generally, research suggests that the balance between optimal yield and orchard health is somewhere between 85-90% of full irrigation. By irrigating at this level, it reduces the risk of over-irrigation in the wetter areas of the field, while maintaining close to optimal yield in the under-irrigated areas.
Remember, understanding the Kc value is just one part of irrigation scheduling. Other considerations will be covered in future posts.
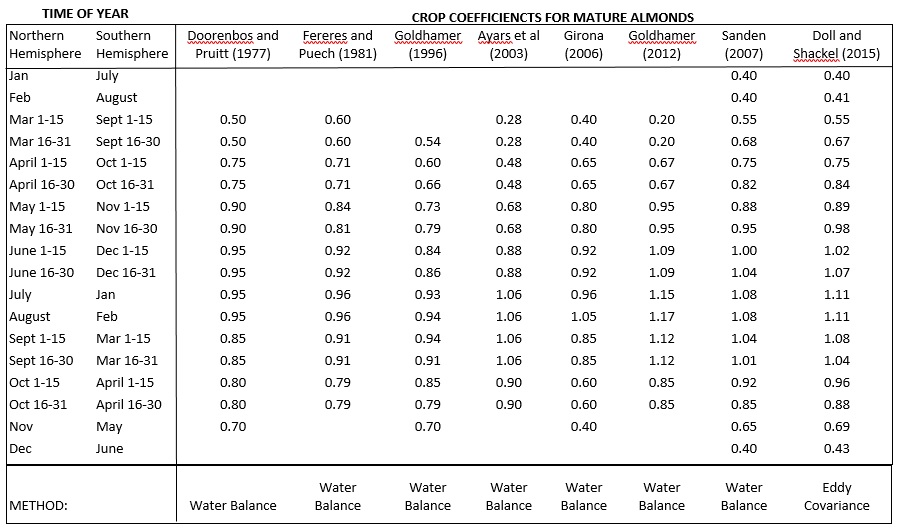
References for Crop Coefficients:
Doorenbos and Pruitt (1977). FAO 24: Irrigation and Drainage Paper.
Fereres, E. and Puech, I. 1981. Irrigation scheduling guide. California Department of Water Resources, Sacramento, CA.
Fereres, E. and Puech, I. 1981. Irrigation scheduling guide. California Department of Water Resources, Sacramento, CA.
Goldhamer, D. 1996. ‘Irrigation Scheduling’ in: Micke, W. The Almond Production Manual. University of California Division of Agriculture and Natural Resources, Oakland, CA.
Ayars, J.E., Johnson, R. S., Phene, C.J., Clark, D.A. & Mead, R.M. 2003. Water use by drip irrigated late season peaches. Irrigation Science 22: 187-194.
Girona, J. 2006. La respuesta del cultivo del almendron al riego. Vida Rural 234, 12-16.
Goldhamer, D. and Girona, J. 2012. FAO 66: Crop yield response to water.
Sanden, B. 2012. Kern Soil and Water.
Doll, D. and Shackel, K. 2015. Drought management for California almonds.

Drought and Almonds: Spring Considerations - The Almond Doctor
March 7, 2021[…] demonstrating how to calculate almond water use and irrigation needs. Including determining ETo, crop coefficients, and scheduling (Part 1, Part 2, and Part 3). There are also useful online scheduling tools, such […]