The almond acreage report for 2016 was released by California Department of Food and Ag (CDFA) on April 26, 2017. Click HERE to link to the report. This report is developed from voluntary grower survey responses, pesticide use reports and the annual nursery sales report. Along with total almond acreage for 2016, [940,000 bearing acres and 3000,000 non-bearing acres], the report gives values for the acreage in individual counties, Nonpareil planting by county, and trees by variety. While not perfect, the report gives a sense of how much is being planted and what varieties are being planted.
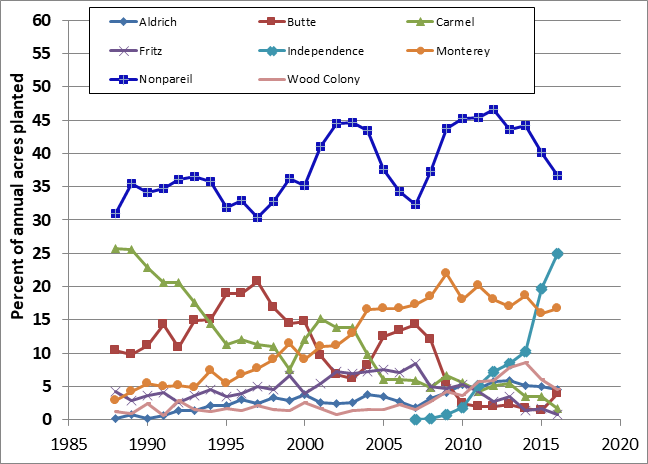
Curious about what varieties are being planted in the state and in what proportion, I calculated the percentage of total plantings for each reported variety over time from the raw numbers in the report. I selected the top eight varieties and made the graph of percentage acres planted over time that appears below. Growers can see for themselves the patterns of acres planted by variety as the industry has grown.