
Written by David Doll (UCCE Merced County) and Allan Fulton (UCCE Tehama County)
This past week I presented on our preliminary findings of the water production function trials underway across the state. Highlights included the release of some newer crop coefficients that were determined using eddy-covariance stations placed in the North and South, discussion on water needs, and the impact of water stress on crop growth. Of most interest was the crop coefficients, which were higher than what most operations use, and led to the questions of the need for that much water.
Crop coefficients (Kc) are derived to estimate ET for various crops as they develop over the course of a season. Kc’s are developed under conditions where soil moisture is not limited and the crop is not stressed at all. So, they represent maximum ET or water use. . In the case of almonds, there have been several recent efforts to determine these values (see below). Various methods have been used ranging from simpler soil-water balance to more advanced biometeorologic eddy-covariance measurements. All of these have led to significantly higher calculated Kc’s and crop ET, with one set suggesting that around 60″ of water was needed in Bakersfield conditions.
It is important to keep in mind that ET does not equal irrigation need. The two will be more similar in almond growing areas with lower rainfall and more different in higher rainfall areas. Water holding capacity of orchard soils and root depth will also influence the relationship between ET and irrigation need. Even increases in production do not necessarily correspond with higher ET and more irrigation. There is increasing evidence that when given the conditions, “luxury consumption” of water will occur. In other words, the water demand is present, but crop load does not increase. This highlights the value of determining the impacts of water applications on production.
Evaluating the impacts of applied water on almond production is not a new concept. Work has occurred in Spain, California, and Australia. These trials generally were single location experiments which were monitored over multiple years. Interestingly, the trials came to relatively the same conclusion: yield increases linearly with increased water applications up to a point, then begins to plateau, and once water is over-applied, begins to drop due to loss of tree health. Even of more interest is that the trials suggest that maximum water use efficiency is somewhere between 80-90% of estimated evapotranspiration (ETc). This 10-20% reduction is generally attributed to the implementation of some level of tolerable stress during the summer.
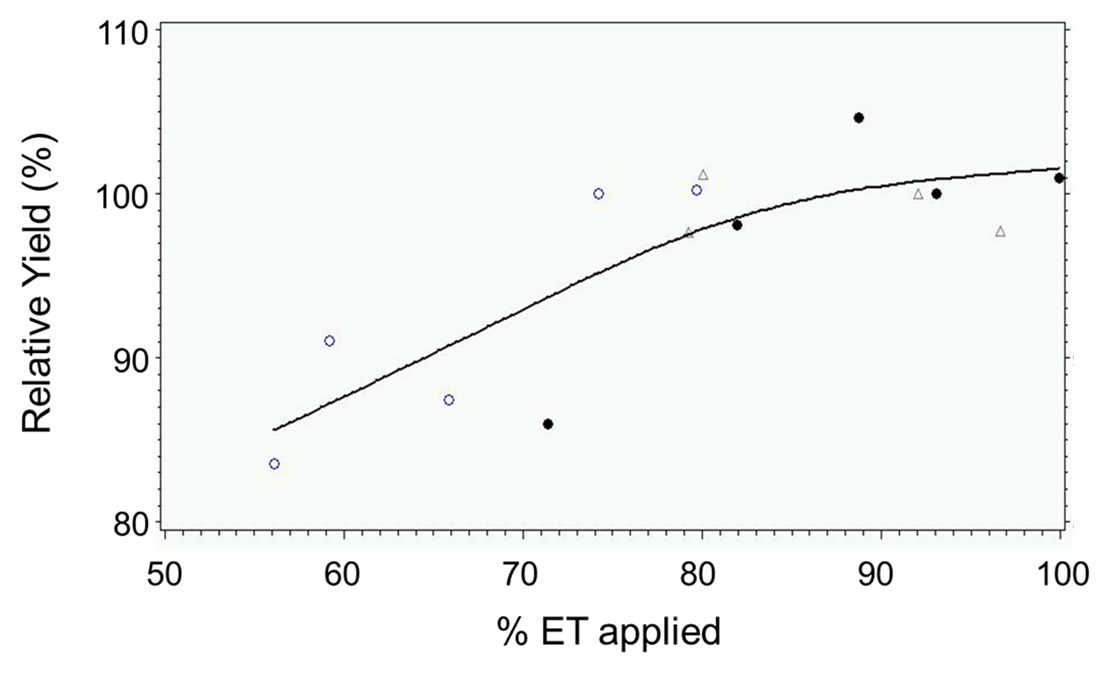
So, how do the recent trials in California compare? Surprisingly, similar. In 2012, a series of five year trials were established across California. Each trial is in a distinctively different geography and soil type (Tehama, Merced, and Kern Counties). Treatments include applying variable amounts of water ranging from 65% -110% of ETc using the newly released crop coefficients. After three years, we have observed the following preliminary results:
- Although yield continues to increase as water applications approach 100% of ETc, the slope of the curve begins to bend (decline) around 80-85%, indicating a drop in WUE (less crop per drop) as we irrigate above this percentage;
- Merced and Tehama sites are showing small increases in canopy with increased irrigation;
- All sites show increase in kernel weight with increasing water applications.
So, what is the take home from all of this? Applying irrigation at 100% ET or at maximum water use by almonds may not be what they need to optimally produce. Applying 10-20% less water than the “modern” crop coefficients may provide the highest water use efficiency and orchard longevity by improving crown and root health, and reducing hull-rot and shaker damage. It is hoped that these conclusions will become more apparent as we continue to monitor the long term impacts of the various levels of irrigation in the current California experiments.
[table id=1 /]